Technical report
Used Car Market Analysis — Technical Report
This report answers two questions: what sets a used-car price, and how accurately the model can predict it. The analysis runs over 29,988 Turkish-plated BMW/Audi listings — from cleaning and leakage checks through controlled price effects, market structure, model comparison and time tests. LightGBM is off by 6.49% on average (MAE: ₺110K, R²: 0.9745), with a 43% lower mean absolute error than the comparable median (same model and year, falling back to a wider median when there is none). Every metric here is computed 5-fold out-of-fold, on data the model never saw in training.
Data cleaning and leakage detection
45,159 TR-plated snapshot rows → 29,988 listings. The 15,171 other rows are the same ad seen again in later snapshots; the latest record per ad_id is kept. The repeats carry information the model does not use: of the 10,831 listings seen in more than one snapshot, 4,703 changed price (2,801 cuts, 1,854 rises; 48 went back to their earlier price).
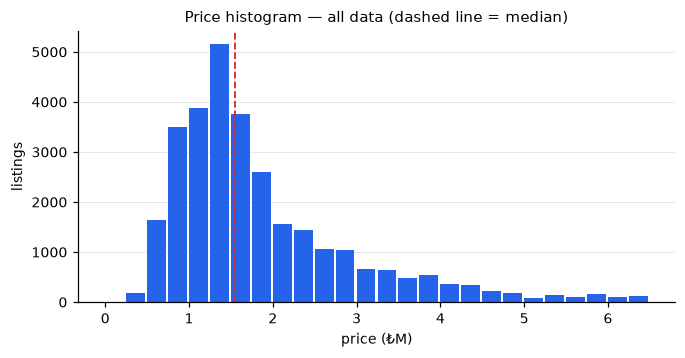
Median asking price ₺1.55M, ranging ₺0.85M–₺3.43M (P10–P90).
Scope: Turkish-plated vehicles only. 22 blue-plate listings (cars of foreign residents) were not taken into the model or the analysis: their tax regime differs and would mislead the model and the analysis. The 54 listings with an empty plate field were not taken in either, since their regime is unknown.
Scope: collection filters. The data was collected from Audi and BMW listings in the site's "otomobil" category with these filters: price ₺300K–₺6.50M, at most 700,000 km, model year 2005 or later, fuel Petrol, Diesel, Hybrid, LPG. Three consequences:
- Price is right-truncated. The most expensive listing sits exactly at the cap (₺6.50M); 10 listings are at the cap and none above it. Cars above the cap are not in the data; predictions at the expensive end should be read with that limit in mind.
- Age is at most 21. Model year 2005 holds 541 listings; older cars were not collected, so the oldest bucket runs into the collection limit.
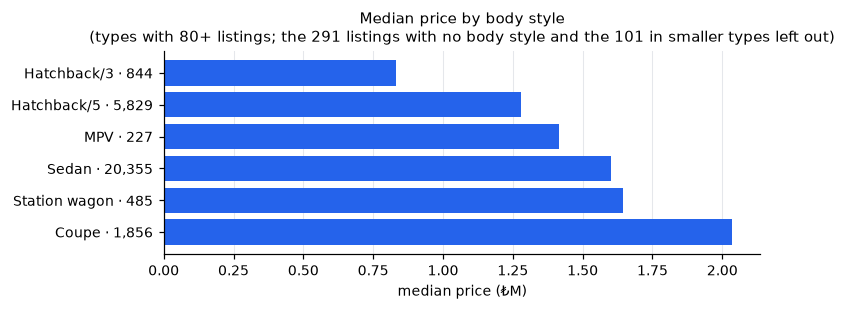
- Body and fuel. Only the "otomobil" category was collected, not the others: the data holds 6 SUVs. The fuel filter leaves electric cars out: 0 electric listings.
Preprocessing and filters
Before the model, these steps were applied to the collected data, in this order:
- Plate: only Turkish-plated rows were taken: 45,159 of 45,315 snapshot rows. 22 blue-plate listings and 54 with an empty plate field were left out entirely (reason above).
- Deduplication: the latest snapshot per
ad_id: 45,159 rows → 29,988 listings. - "Unspecified" = none: an unspecified panel counts as original, an unspecified heavy-damage record as not heavily damaged (below).
- Engine range → one number: size is the range's upper bound, power the mean of the lower and upper bounds (below).
- Damage: 39 raw panel flags were reduced to 12 features (below).
- Missing values: no filling in the numeric features, an empty value reaches the model empty; an empty category becomes its own
missingcategory (below). - No outliers removed: price, km and age were not trimmed; every Turkish-plated listing is in the model.
- Target:
log1p(price).
Scale
| item | value |
|---|---|
| TR-plated snapshot rows (all snapshots) | 45,159 |
unique listings (ad_id dedup) |
29,988 |
| snapshots | 4 (2026-01-18 – 2026-06-27) |
| raw columns (feed) | 117 |
| model features | 25 |
| BMW / Audi | 17,896 / 12,092 |
| target | log1p(price) |
Three data layers
- Structural — age · km · engine power/size · body · fuel · transmission · drivetrain · segment.
- Damage / inspection — 13 body panels × {changed, painted, local paint} + the heavy-damage record. Those 39 raw flags reach the model as 12 features: roof · hood · trunk are single panels, so they carry a state (original/local/painted/changed), while door · fender · bumper carry a within-group count (doors 0–4, fenders 0–4, bumpers 0–2).
- Free text — the seller's description; not used by the model. It was measured: it adds 0.0015 to R²; the detail is in §10.
"Unspecified" panels were counted as original. The site gives one of five answers per panel: original, unspecified, painted, locally painted, changed. Across the listings in the model 59,651 panels (15.3%) are unspecified; on 1,235 listings all 13 are. That answer was coded as original by a deliberate decision, on the reasoning that the seller may have forgotten to list damage but no damage is the likelier case.
The heavy-damage record follows the same rule. On 68.2% of the listings in the model the page gives no heavy-damage answer ("Belirtilmemiş" or no field); those listings count as not heavily damaged. A heavily damaged car whose listing does not say so looks free of heavy damage to the model.
Engine power and size: from a range to one number
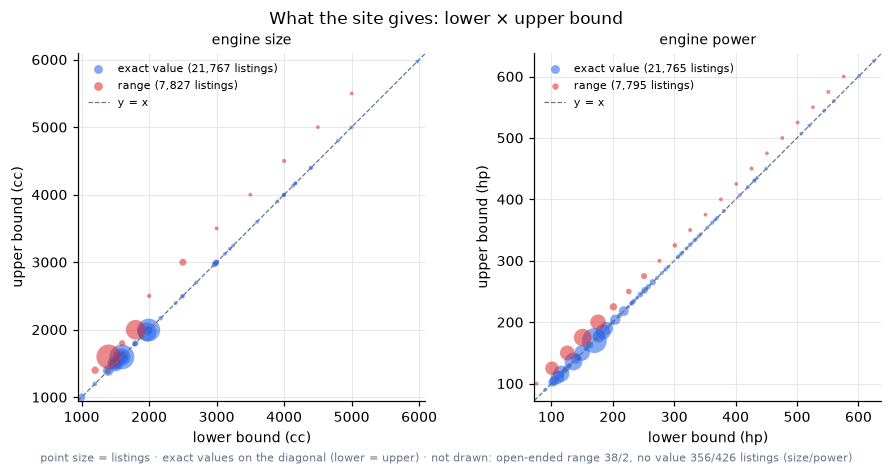
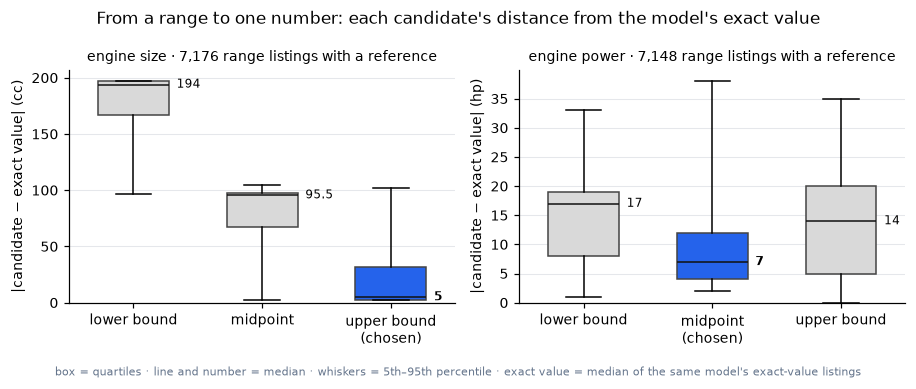
On some listings the site gives engine size and power as an exact value, on others as a range: among the listings in the model, 7,865 have engine size and 7,797 have power as a range (the most common are 1401–1600 cc and 151–175 hp). The model uses one number. The rule: size = the range's upper bound, power = the mean of the lower and upper bounds (the known bound for an open-ended range). The rule was checked against the data: each range listing's three candidates were compared with the median of the same model's exact-value listings — 7,176 listings for size, 7,148 for power (models that have at least one exact listing).
Example: a listing given as 1401–1600 cc belongs to a model whose exact-value listings most often say 1598 cc; for this listing the candidates are the lower bound 1401 (197 cc away), the midpoint 1500.5 (97.5 cc) and the upper bound 1600 (2 cc). The number in the table below is the median of these gaps over all range listings; each model's reference is the median of its own exact-value listings.
| candidate | size: median absolute gap | power: median absolute gap |
|---|---|---|
| lower bound | 194 cc | 17 hp |
| midpoint | 95.5 cc | 7 hp |
| upper bound | 5 cc | 14 hp |
For size the exact value sits right at the top of the range (median position within the range 97.5%, lower quartile 83.9%; the most common exact value among the models in the most common range is 1598 cc), so the upper bound is almost a direct hit; in every range with at least 100 listings (5/5) the upper bound is the closest candidate. For power the closest candidate changes with the power level (ranges with at least 100 listings): 101–125 hp midpoint; 126–175 hp upper bound; 176–225 hp lower bound; 226–250 hp lower bound and midpoint tied; 251–275 hp lower bound. So the exact value's position within the range is spread out (quartiles 29.2%–79.2%). As a single rule the midpoint has the smallest median gap over all range listings. The same model's median exact value falls inside the range for 97.9% of listings on size and 84.2% on power; among the power listings outside it, models with more than one exact power value make up 90.3% — one model name covers several engine options, so this share reflects a coarse reference, not wrong ranges on the site. If the rule stops matching the data (the chosen candidate no longer has the smallest median gap), the generator stops.
The reason is the engine's litre label: an engine sold as "1.6" really displaces about 1598 cc, a few cc below the label. The site's ranges end at those label values (1401–1600 cc), so the real size almost always sits very close to the range's upper bound. Power has no such label; the real values spread across the range, and there the midpoint fits better.
Kept features (25)
Model (model) · Series (series) · Brand (brand) · Body Type (kb_body_type) · Drivetrain (kb_drivetrain) · Segment (segment) — derived from series and model name · Transmission (kb_transmission) · Fuel Type (kb_fuel) · Roof State (roof_state) · Hood State (hood_state) · Trunk State (trunk_state) · Age (years) (vehicle_age) · Mileage (gb_mileage) · Power (hp) (power_hp_val) · Engine (cc) (engine_cc_val) · Door Changed (door_changed) · Door Painted (door_painted) · Door Local Paint (door_local) · Fender Changed (fender_changed) · Fender Painted (fender_painted) · Fender Local Paint (fender_local) · Bumper Changed (bumper_changed) · Bumper Painted (bumper_painted) · Bumper Local Paint (bumper_local) · Heavy Damaged (is_heavy_damaged)
Dropped feature groups
Of the 117 raw columns, 53 reach the model directly or derived (39 of them damage flags), one is the target (price) and 63 were dropped. Every raw column is assigned to exactly one class below; the table is computed from the code.
| group | reason | cols | columns |
|---|---|---|---|
| C | Identity / text / time | 8 | ad_id, listing_date, ad_title, location, eids_model, url … |
| F | Derived duplicate | 9 | engine_cc_low, engine_cc_val, engine_cc_is_range, power_hp_val, power_hp_is_range, count_changed … |
| B | kb/gb twin | 11 | kb_year, kb_mileage, gb_transmission, gb_fuel, gb_body_type, gb_color … |
| A | Quasi-constant (top value ≥ 99%) | 4 | kb_condition, gb_usage_type, gb_is_first_owner, gb_plate_origin |
| D | Missing > 40% | 5 | gb_mtv_yearly, tramer_fee, transmission_brand, gb_kasko_avg, gb_traffic_insurance_avg |
| E | Catalogue block (co-missing) | 22 | kb_fuel_cons_avg, kb_fuel_tank, gb_segment, torque_nm, cylinder_count, max_speed_kmh … |
| G | Not in the model, no recorded reason | 4 | kb_color, kb_trade_available, kb_seller_type, gb_warranty_status |
engine_cc_val, power_hp_val: the database columns (the range midpoint). The model re-derives both from the lower and upper bounds (engine rule above): for power the mean of the bounds, i.e. the same value as the database column; for size the upper bound, i.e. different from the database on range listings.
Numeric features are not imputed: missing values reach LightGBM and CatBoost as NaN and the libraries' own missing-value routing handles them; missing categoricals become their own missing level. Only KMeans/PCA use a global-median fill; torque_nm, missing in 27.6% of listings, was dropped.
Leakage control. Dedup runs on ad_id, before the CV split. Evaluation is 5-fold out-of-fold: every listing is predicted exactly once, by a model that never saw it.
Content-based duplication
| definition | excess rows | share |
|---|---|---|
| strict — every distinguishing field identical | 137 | 0.46% |
| loose | 209 | 0.70% |
| strict without price | 1,278 | 4.26% |
The risk ad_id cannot see: different ad_id, same car. The strict definition finds 127 duplicate groups; its columns: price, gb_mileage, gb_year, brand, series, model, kb_fuel, is_heavy_damaged, count_painted, count_changed, power_hp_up, engine_cc_up. Some are genuine re-posts, some coincidental matches on common models. The first two definitions require the same price, so they cannot see a listing re-posted at a new price. The strict definition without price finds 1,278 excess rows (4.26%); how many of those are re-posts at a new price and how many coincidental matches on common models cannot be told apart from the data. By these two definitions the share that could leak across folds is between 0.46% (strict) and 4.26% (without price); neither can see a re-post whose mileage was changed too.
Most repeated listings:
| model | year | price | repeats |
|---|---|---|---|
| 320i Sport Line | 2025 | ₺4,900,000 | 4 |
| 318i Standart | 2005 | ₺717,000 | 3 |
| A3 Sportback 1.6 Ambition | 2010 | ₺890,000 | 3 |
| 116d Joy Plus | 2015 | ₺1,044,950 | 3 |
| 320i First Edition Sport Line | 2019 | ₺2,530,000 | 3 |
Missingness isn't random
32 columns are over 2% missing. 22 of them sit in four blocks that drop together: this isn't "missing data", it's listings where catalog matching collapsed — standard models match, niche variants don't, and all their specs go blank at once. Because it is systematic, reliable imputation is impossible → dropped. The other 10 columns are missing for other reasons and each was dropped in its own class (§1 table) — missing > 40%: tramer_fee, transmission_brand, gb_traffic_insurance_avg, gb_kasko_avg, gb_mtv_yearly · kb/gb twin: gb_drivetrain, gb_trade_available · not in the model, no recorded reason: gb_warranty_status, kb_trade_available · identity / text / time: eids_model.
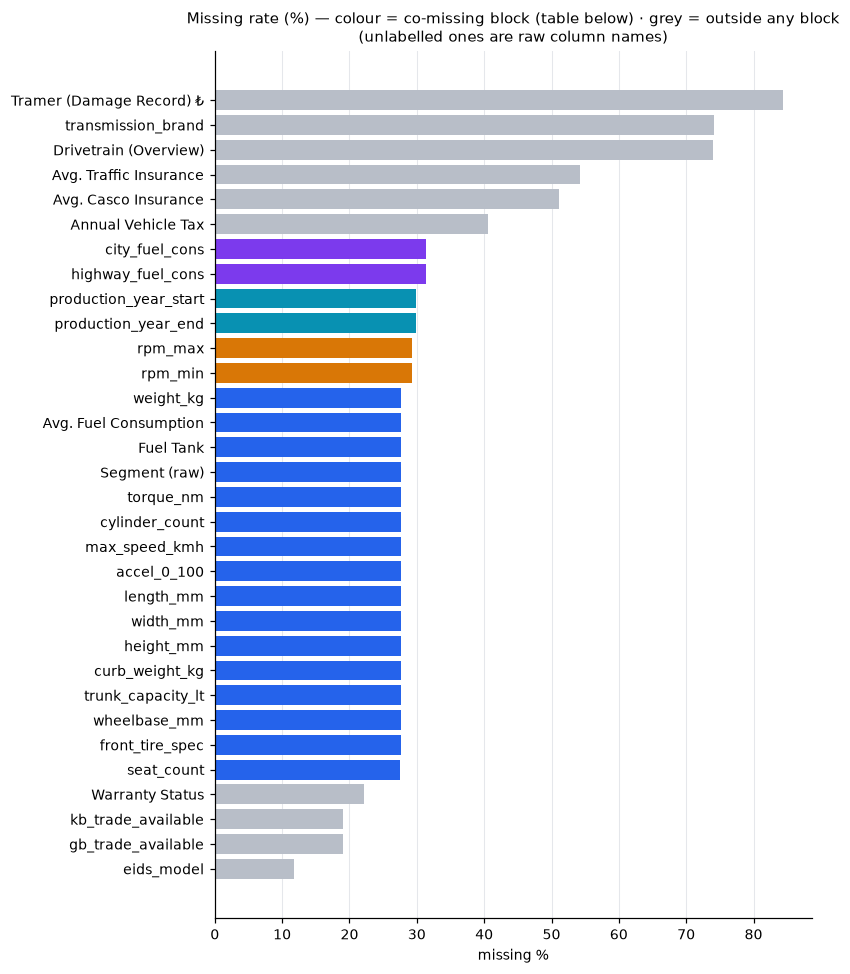
Missingness is not an issue in the 25 features that remain: the worst is kb_drivetrain at 1.5% and 21 have none at all. The chart above covers only the dropped columns.
"Unspecified" is not missing data. What the page does not say stays empty in the data. In 45 columns that gap is not missing data but the seller's "unspecified" answer; these columns are kept out of the list and the blocks above. The heavy-damage record is unspecified on 68.2% of the listings, and each of the 39 panel flags on 12.2%–19.1%. The model reads these unknowns as "no" by a deliberate decision: an unspecified panel counts as original, an unspecified heavy-damage record as not heavily damaged (§1).
Co-missing blocks
| cols | avg missing | missing together | example columns |
|---|---|---|---|
| 16 | 27.6% | 98.8% | weight_kg, kb_fuel_cons_avg, kb_fuel_tank, gb_segment … |
| 2 | 31.4% | 100.0% | city_fuel_cons, highway_fuel_cons |
| 2 | 29.9% | 100.0% | production_year_start, production_year_end |
| 2 | 29.3% | 100.0% | rpm_max, rpm_min |
Missing together: listings where every column of the block is missing, as a share of listings where at least one is.
gb_ / kb_ dual source
| field | Overview (gb) empty | QuickInfo (kb) twin |
|---|---|---|
Drivetrain (gb_drivetrain) |
74.0% | kb_drivetrain · missing 1.5% |
Avg. Traffic Insurance (gb_traffic_insurance_avg) |
54.3% | none |
Avg. Casco Insurance (gb_kasko_avg) |
51.1% | none |
Annual Vehicle Tax (gb_mtv_yearly) |
40.6% | none |
kb/gb. The same field can appear in two tabs of a listing page: kb is quick info, gb the overview. In 8 of the 10 pairs the two tabs are identical. In 6 pairs one side is in the model and the other was dropped; in 4 pairs (color, condition, trade_available, seller_type) neither side is in the model. The twin class in the §1 table holds one more column: kb_is_heavy_damaged, identical to is_heavy_damaged. For drivetrain gb is empty on 74.0% of listings, kb on 1.5%. For body type kb was chosen because it is more general: 9 categories, while gb merges the same information with the seat count into 23 values. The 3 fields with no counterpart and over 40% empty (Avg. Traffic Insurance, Avg. Casco Insurance, Annual Vehicle Tax) were dropped.
Redundancy, dependence and brand
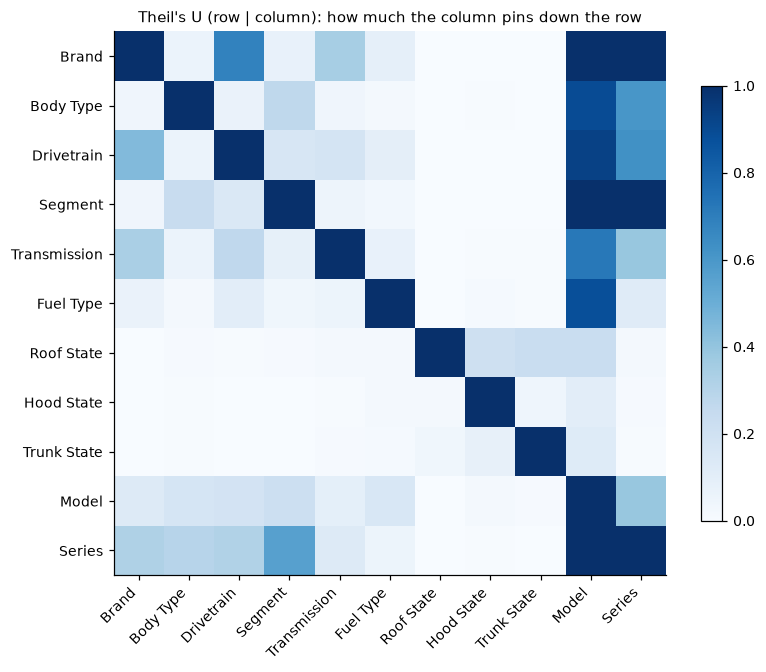
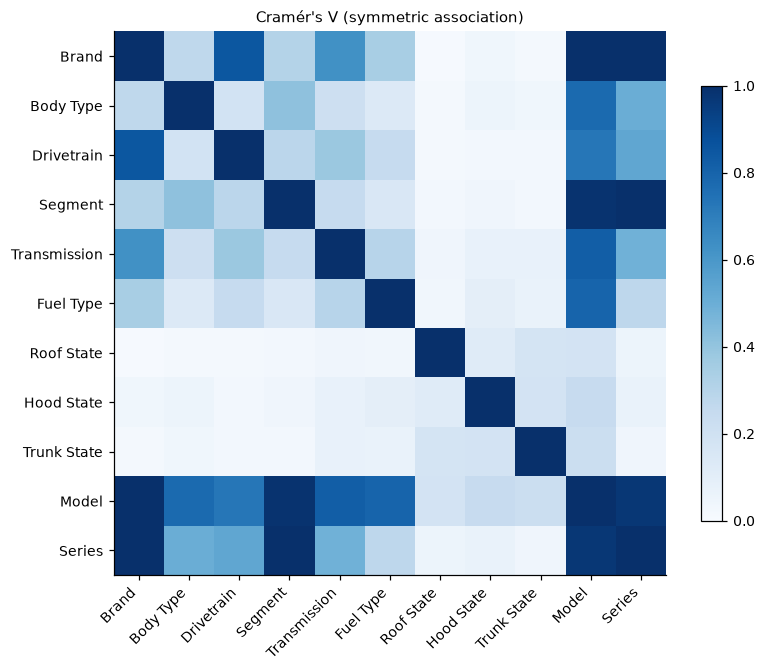
Cramér's V gives association strength (symmetric); Theil's U its direction (asymmetric). The asymmetry is the finding: model almost fully determines brand, segment, series (U ≥ 0.99) but not vice-versa — series is a coarsened view of model, not independent information. For the other columns U is lower; the lowest is Hood State (0.10).
Why read against a floor? model has 745 distinct values and most of them have only a few listings. In a group of a few listings another field's values can match by chance (e.g. both of two listings have an original hood), and the measure counts that as "model determines the hood". So any field paired with model looks high even without a real relationship: both measures are biased upward at high cardinality. To see how large that inflation is, the model column was shuffled at random across listings and the measure recomputed; shuffling keeps every value's count but destroys any real relationship. The mean of 5 shuffles is the permutation floor: ~0.16 on Cramér's V and 0.02–0.15 on Theil's U, depending on the field. A value in the model column means only as much as it rises above that floor:
- Hood State: Theil's U 0.10, floor 0.04.
- Roof State: Cramér's V 0.18, floor 0.16; almost all of the gap is chance.
Theil's U giving direction does not remove this inflation; it has its own floor. The damage counts and the engine fields (hp/cc) are numeric, so they are absent from these matrices — the correlation table below covers them.
Theil's U asymmetry
| direction | reads as | U |
|---|---|---|
| U(series | model) | how much model pins down series | 0.999 |
| U(model | series) | how much series pins down model | 0.387 |
| U(brand | model) | brand given model | 1.000 |
| U(brand | series) | brand given series | 1.000 |
Model determines series at 1.00; series determines model only at 0.39. Brand is fully readable from either model or series → brand carries no separate information (the brand ablation below measures the same thing).
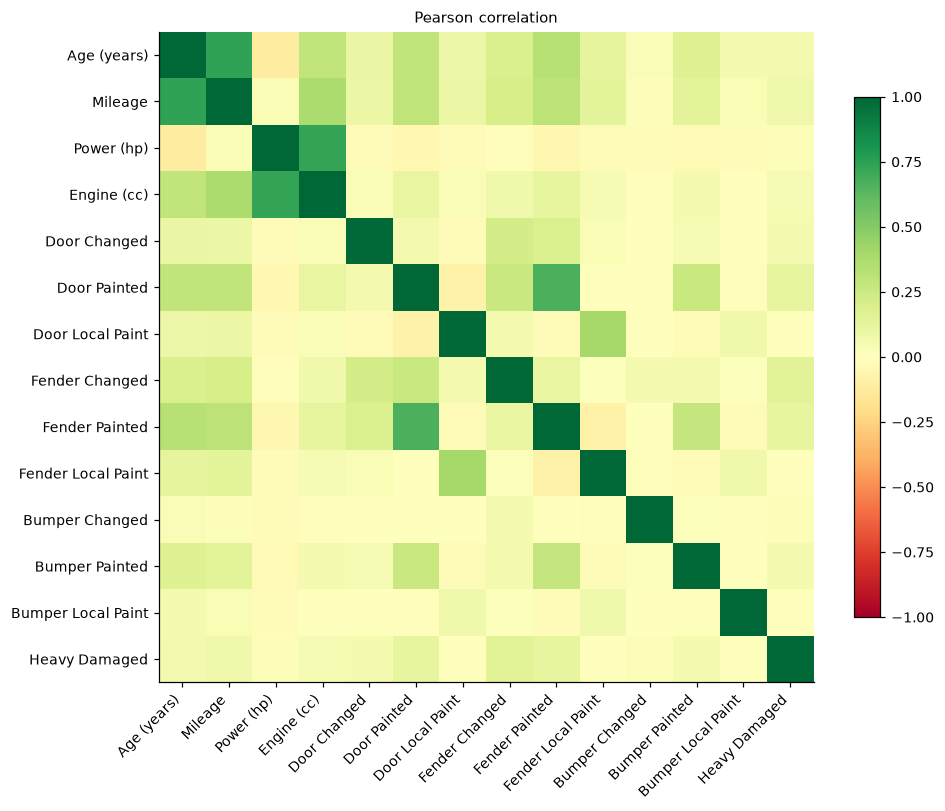
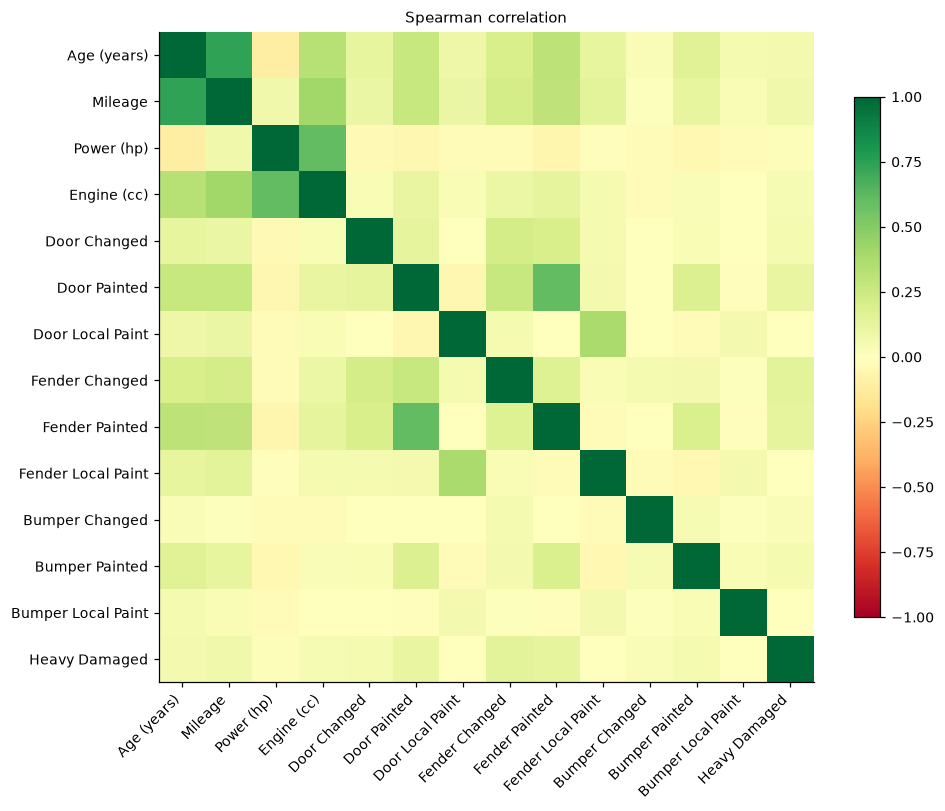
Correlation among numeric features — the numeric counterpart to the categorical dependence above. |r|>0.5 pairs are flagged for collinearity. The VIF table in §6 only covers the hedonic model's terms; door and fender paint enter there as the total painted-part count, not separately.
Segment is derived, not fed
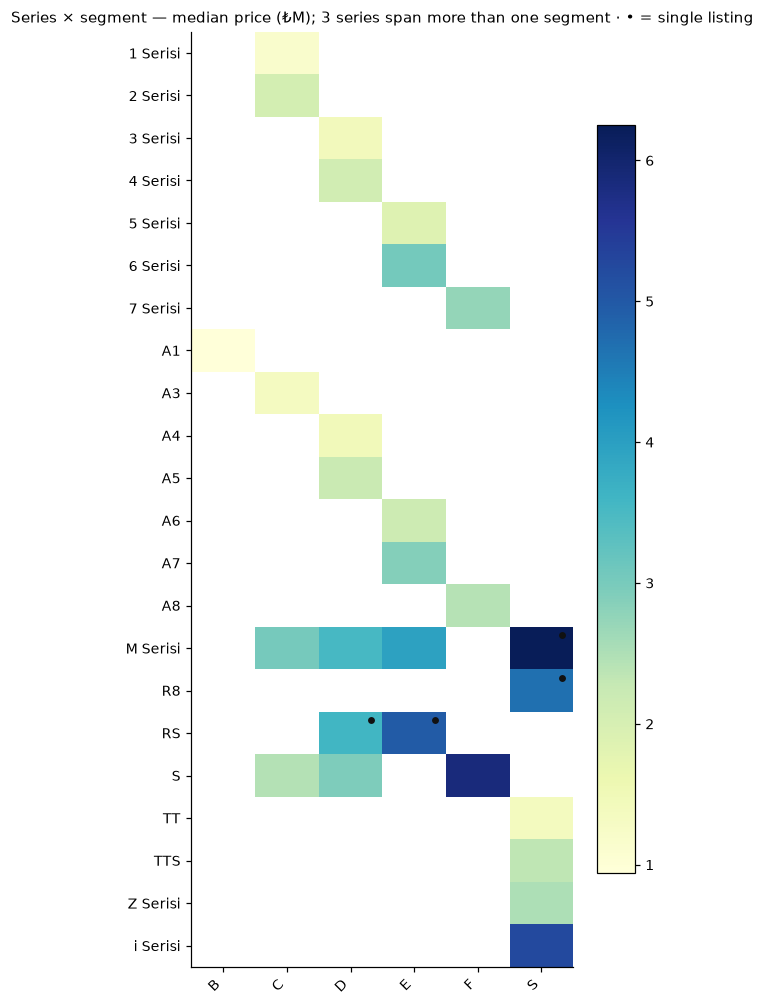
The raw gb_segment is not used, and missingness is not the only reason: the feed's "G" segment is not a real segment. Of the 215 listings carrying that label, 214 have an MPV body and all come from one series — a corrupt source. Segment is therefore derived, with the MPV signal kept in body type.
29,832 listings take their segment straight from the series. In some families (M Serisi, RS, S, i Serisi) the segment is resolved from the model name, not the series — e.g. M3 → 3 Series, S3 → A3 — 156 listings in all. So segment is a function of (series, model), not series alone: U(segment | series) = 0.997, not exactly 1. If any series or model cannot be resolved the generator stops; there is no silent default segment.
The derived label differs from the feed on 404 of the 21,723 listings that have a raw segment (1.9%); 215 of those are the deliberate G fix, and the next largest source is 95 listings the feed calls E and the derivation calls D.
High-correlation pairs (|r| > 0.5)
| feature A | feature B | Pearson r |
|---|---|---|
| Age (years) | Mileage | 0.737 |
| Power (hp) | Engine (cc) | 0.730 |
| Door Painted | Fender Painted | 0.670 |
Brand ablation
| identity columns | MAPE | MAE | R² |
|---|---|---|---|
| brand only | 8.80% | ₺163K | 0.9413 |
| series + model | 6.49% | ₺110K | 0.9745 |
| brand + series + model (the report's model) | 6.49% | ₺110K | 0.9745 |
Only the identity columns change in the full model, everything else fixed; same 5-fold OOF. The "brand only" arm also drops segment, because segment is derived from series. Giving brand alone instead of series+model worsens MAE by ₺53K. Adding brand on top of series+model changes MAE by ₺1 (MAPE delta 0.00 pts) — across the headline model's 5 folds brand is used in 26 splits but does not change the error. This is the data's definition more than a measurement: every series here belongs to one brand (U(brand | series) = 1.00), so brand can be read off the series.
Target and preprocessing
Raw price is right-skewed (skew 1.62); a log transform pulls it toward symmetry (0.28). The model trains on log1p(price): on the log scale a difference is a relative (percentage) difference, so the same percentage error weighs the same on a cheap and an expensive car. A modelling decision, not a market finding.
Market structure — segmentation (KMeans + PCA)
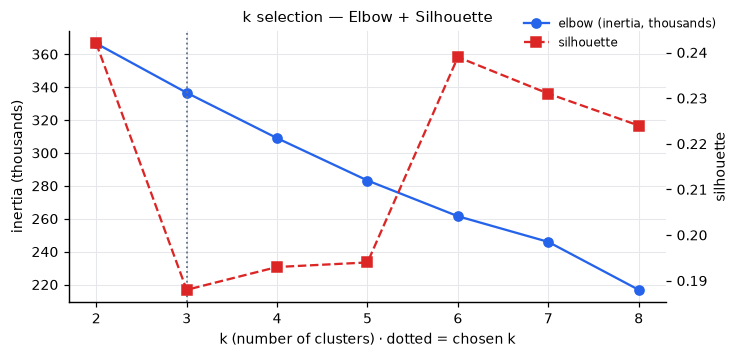
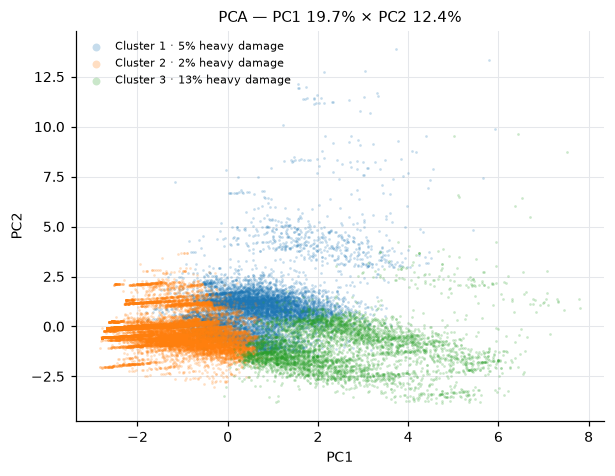
k=3 was not chosen by silhouette. Silhouette at k=3 is 0.188 — rank 7 of the 7 values tried; the highest is k=2 (0.242). All sit below 0.25: the data has no pronounced natural clusters. k=3 was fixed for interpretability; read the clusters through the axes below, not as "the market's natural structure".
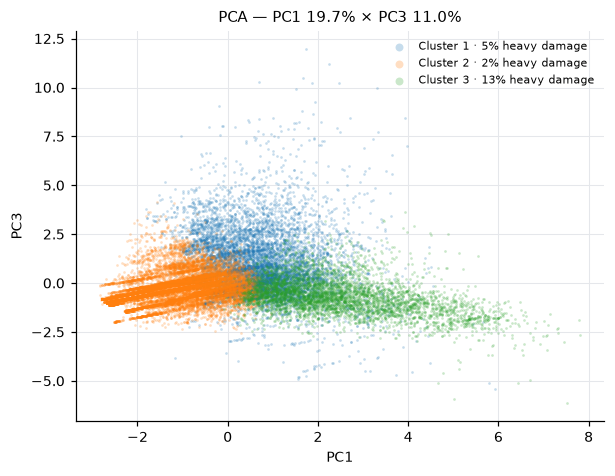
Axes separating the clusters
| cluster | listings | top 3 axes vs the mean |
|---|---|---|
| Cluster 1 · 5% heavy damage | 9,046 | Mileage ↑ · Fender Local Paint ↑ · Engine (cc) ↑ |
| Cluster 2 · 2% heavy damage | 15,976 | Mileage ↓ · Age (years) ↓ · Engine (cc) ↓ |
| Cluster 3 · 13% heavy damage | 4,966 | Door Painted ↑ · Fender Painted ↑ · Fender Changed ↑ |
↑/↓ = cluster mean above/below the overall mean (top 3 by z-score magnitude). The clusters are not named: k was fixed for interpretability, so read them through this column.
PCA loadings
| PC | variance | top 4 loadings |
|---|---|---|
| PC1 | 19.7% | Mileage (+0.46) · Age (years) (+0.45) · Fender Painted (+0.41) · Door Painted (+0.41) |
| PC2 | 12.4% | Power (hp) (+0.65) · Engine (cc) (+0.61) · Fender Painted (-0.24) · Door Painted (-0.24) |
| PC3 | 11.0% | Fender Local Paint (+0.58) · Door Local Paint (+0.57) · Power (hp) (-0.28) · Bumper Local Paint (+0.22) |
The first 3 components explain 43.1% of variance. PC1 ≈ Mileage + Age (years) + Fender Painted + Door Painted · PC2 ≈ Power (hp) + Engine (cc) · PC3 ≈ Fender Local Paint + Door Local Paint.
Hedonic model — controlled effects
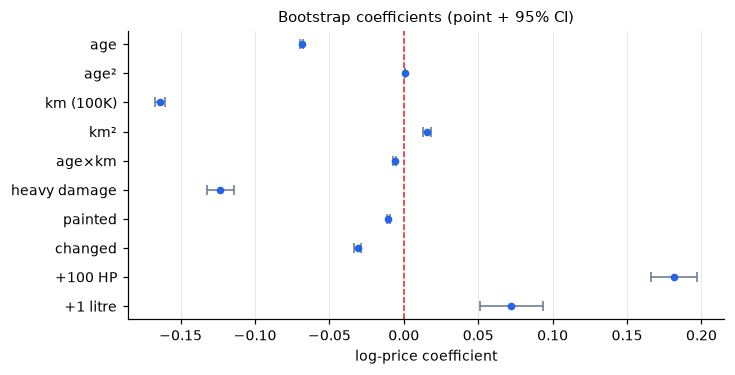
The hedonic regression gives each driver's controlled effect on price (all else equal) — R² 0.9312, n 29,554. Coefficients carry bootstrap confidence intervals; all 10 terms have a 95% CI excluding zero → each driver is reliably significant.
model does not enter this regression. Its cardinality is very high (745 distinct values); series is not in the regression either, only segment. Measured: adding C(model) moves R² from 0.9312 to 0.9648 — about 87% of the gap between the hedonic R² and the model's OOF R² on the same scale (0.9699, log price) is model identity — an upper estimate: the R² with C(model) is in-sample while the model's is OOF (the two also come from different n: hedonic 29,554, model 29,988 listings). The linear coefficients keep their sign but shift in size: age -6.64% → -5.80%, +100 hp +19.86% → +19.30%, 1 litre +7.49% → +5.97%, 100k km -15.11% → -14.83%. So the "controlled" effects here are controlled for everything except model identity. The model's headline R² (0.9745) is on the raw ₺ scale and should not be read against the hedonic one.
Note: The hedonic model is an OLS and cannot run with missing values, so listings with missing engine power (426) or missing displacement (356) were removed before the analysis. Once the rows missing both are counted only once, 434 rows in total were dropped from the dataset.
Bootstrap coefficients
| term | effect | log coef [95% CI] | effect 95% CI | significant |
|---|---|---|---|---|
| age | -6.64% | -0.0687 [-0.0695, -0.0680] | -6.71% … -6.57% | yes |
| age² | +0.08% | +0.0008 [+0.0007, +0.0010] | +0.07% … +0.10% | yes |
| km (100K) | -15.11% | -0.1638 [-0.1673, -0.1604] | -15.41% … -14.82% | yes |
| km² | +1.56% | +0.0155 [+0.0127, +0.0184] | +1.28% … +1.86% | yes |
| age×km | -0.62% | -0.0062 [-0.0074, -0.0050] | -0.74% … -0.50% | yes |
| heavy damage | -11.60% | -0.1233 [-0.1321, -0.1140] | -12.37% … -10.77% | yes |
| painted | -1.05% | -0.0105 [-0.0114, -0.0096] | -1.13% … -0.96% | yes |
| changed | -3.06% | -0.0311 [-0.0332, -0.0290] | -3.27% … -2.86% | yes |
| +100 HP | +19.86% | +0.1812 [+0.1659, +0.1972] | +18.05% … +21.80% | yes |
| +1 litre | +7.49% | +0.0723 [+0.0510, +0.0933] | +5.23% … +9.78% | yes |
Effect = exp(β)−1. Age and km are centred on the median car (11 years, 181,000 km): the age and km rows are the marginal effect at that car. Squared and interaction terms (age², km², age×km) are not read alone; they carry the curvature.
Engine effect
+100 HP → +19.9%, +1 litre → +7.5% (same regression, the other held fixed). Displacement's effect is what remains once power is fixed; the units differ, so the two numbers are not directly comparable.
cc–HP correlation by fuel
| fuel | Pearson | Pearson (log) | Spearman | cc / HP | n |
|---|---|---|---|---|---|
| Petrol | 0.806 | 0.731 | 0.407 | 9.8 | 14,693 |
| Diesel | 0.836 | 0.863 | 0.694 | 11.1 | 12,783 |
| LPG & Petrol | 0.900 | 0.863 | 0.805 | 13.9 | 1,199 |
| Hybrid | 0.429 | 0.522 | 0.308 | 10.0 | 879 |
Overall correlation 0.73. The relationship varies by fuel — weakest for Hybrid (Pearson 0.429, n 879). Displacement cannot be derived from power; both stay as separate features.
VIF — multicollinearity
| term | VIF (fitted model) | VIF (uncentred) |
|---|---|---|
| age | 3.69 | 34.54 |
| age² | 4.84 | 66.54 |
| km | 4.03 | 29.95 |
| km² | 3.61 | 34.49 |
| age×km | 7.25 | 96.28 |
| heavy damage | 1.05 | 1.05 |
| painted | 1.25 | 1.25 |
| changed | 1.12 | 1.12 |
| +100 HP | 4.77 | 4.77 |
| engine (L) | 5.56 | 5.56 |
The values come from the fitted model's own design matrix. The highest is age×km 7.25 — below 10. In the uncentred design the same group is far higher (age×km 96.28): age, age², km, km² and age×km are all built from two variables, so they are structurally linked. Centring on the median car removes that; predictions and R² do not change, only the meaning of the linear coefficients sharpens. Among the dummies the highest VIF is C(segment)[T.D] (62.42): a dummy's VIF inflates when its reference level is small and only affects that dummy's standard error, which is not reported here.
Assumption tests
Breusch-Pagan (equal variance) p = <0.001 · Jarque-Bera (normality) p = <0.001 → both violated. Inference therefore does not rest on plain OLS p-values: the intervals are the 2.5–97.5 percentiles of a bootstrap that resamples the rows with replacement 1000 times and refits the model each round. The model is also fitted with HC3 robust covariance, which does not enter the published intervals.
LOFO — leave-one-feature-out
LOFO is a second, independent method: drop each feature and measure how much CV error grows. It measures something different from SHAP — the part the remaining features cannot make up for. The ranking does not match SHAP's: LOFO gives Mileage > Age (years) > damage group > model/series name > engine (hp + cc); SHAP Age (years) > engine (hp + cc) > Mileage > model/series name > damage group. The sharpest gap is engine (hp + cc): 2nd in SHAP, 5th in LOFO (ΔRMSE ₺524) — when it is removed the model largely makes it up from other features.
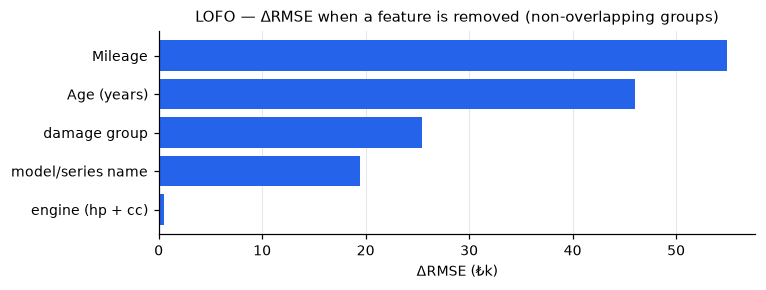
The chart shows 5 bars while the model uses 25 features. Coverage:
| coverage | count | where |
|---|---|---|
| features measured | 19 | 2 as their own bar, 17 inside the groups |
| measured as a group | 3 groups | DAMAGE_COLS · MODEL_SERIES · ENGINE |
| features never measured | 6 | brand · kb_body_type · kb_drivetrain · segment · kb_transmission · kb_fuel |
Model comparison and limitations
The report's model: LightGBM (model/series name TF-IDF+SVD) — MAPE 6.49%, R² 0.9745, MAE ₺110K. Target log1p(price), 25 features. 43% lower mean absolute error than the comparable-median baseline (same model and year; a broader median when there is no comparable).
What TF-IDF+SVD is applied to. Not the free-text description — only the model and series name strings (e.g. "A4 Sedan 2.0 TDI"). The point is to let rare name combinations borrow information from their neighbours through name similarity, covering exactly where target encoding weakens in sparse cells. The seller's description never enters the model (see §1, third layer).
Model variants
| variant | MAPE | R² | MAE | MedAE | RMSE |
|---|---|---|---|---|---|
| LightGBM (model/series name TF-IDF+SVD) | 6.49% | 0.9745 | ₺109,776 | ₺75,320 | ₺176,225 |
| CatBoost (model/series name TF-IDF+SVD) ★ | 6.44% | 0.9745 | ₺110,085 | ₺74,927 | ₺176,130 |
| CatBoost (model/series name native text) | 6.58% | 0.9739 | ₺112,925 | ₺77,660 | ₺178,312 |
| comparable median (baseline, laddered) | 11.20% | 0.9235 | ₺191,224 | ₺130,000 | ₺305,050 |
★ = winner under the MAPE-only rule: CatBoost (model/series name TF-IDF+SVD). But the two TF-IDF+SVD variants differ by 0.05 MAPE points and ₺309 MAE; LightGBM leads on MAE, CatBoost on MAPE, MedAE, RMSE → in practice they are tied. Throughout this report "the model" is LightGBM: deterministic on CPU, whereas CatBoost's trees depend on the device (GPU/CPU) — an earlier GPU run had the MAPE order reversed. The conformal interval, brand ablation and sample predictions all come from LightGBM.
Baseline tier breakdown
| tier | listings | share | MAPE | MAE | R² |
|---|---|---|---|---|---|
| model + year | 29,236 | 97.49% | 10.69% | ₺179K | 0.9450 |
| model | 596 | 1.99% | 26.70% | ₺559K | 0.6082 |
| global | 156 | 0.52% | 47.38% | ₺1.10M | -0.2359 |
Ladder: (model, year) median → (model) median — all years → global median. If the test (model, year) cell is absent from the training fold, the baseline steps down a rung; error grows sharply at each step — without a comparable the baseline is weak anyway. Medians are computed on the training part of each fold only (leak-free, same 5 folds as the model).
Model limitations and observations. Information that never reaches the form fields and hides in the free text — modifications, special equipment, tax-exemption status — does not enter the model; listings whose text mentions a conversion or modification have a raw large-error rate of 4.9% against 3.9% for the rest; with age, mileage, price, performance family, comparable count and brand held fixed the odds ratio is 1.14 (95% CI 0.94–1.37): no significant difference was measured. The wording appears in 43.6% of performance-family listings. Without comparables the error grows markedly: with no other listing of the same model and year the large-error rate is 19.0%, with 100+ comparables 2.9%; the largest lira errors sit at this end too (§8). No extensive hyperparameter optimisation was run, by choice; its payoff was not measured in this report.
Sample predictions
| band | car | age | km | actual | LightGBM | dev. | OOF resid. | CatBoost (model/series name SVD) |
|---|---|---|---|---|---|---|---|---|
| economy | 116i Comfort | 17 | 174,000 | ₺718,000 | ₺714,062 | 0.5% | 0.0% | ₺709,186 |
| mid | 520d Premium | 14 | 300,000 | ₺1,480,000 | ₺1,490,900 | 0.7% | 0.0% | ₺1,437,492 |
| premium | 520i Luxury Line | 4 | 96,000 | ₺3,680,000 | ₺3,640,718 | 1.1% | 0.0% | ₺3,615,892 |
// These are best-case examples, not typical ones. In each price band the pick is the non-heavy-damaged listing with the smallest |OOF residual|. "dev." is the final model trained on all data (it saw the listing); the leak-free measure is "OOF resid.". For typical error see MAPE.
Calibration, residuals and where it is weak
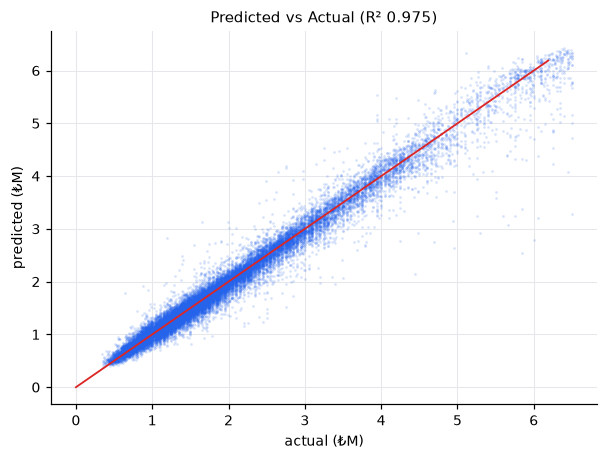
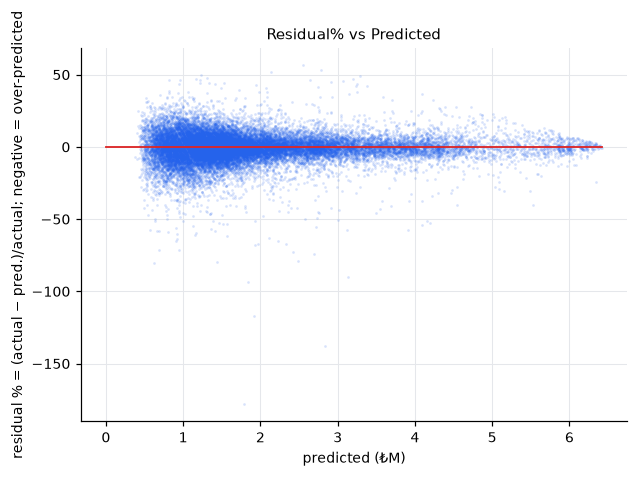
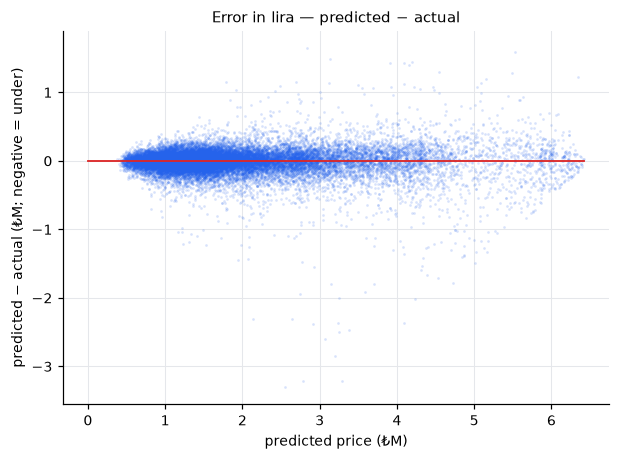
OOF (leak-free) predictions vs actual — R² 0.9745. Residual% is close to zero on average (mean -0.47%, std 9.27%). It holds at every level of the prediction too: the slope of actual on predicted price is 1.003, and the mean bias across predicted-price quartiles ranges from −₺12K to −₺3K.
Error distribution
| |error| band | listings | share |
|---|---|---|
| ≤ 5% | 15,775 | 52.6% |
| 5% – 10% | 8,221 | 27.4% |
| 10% – 20% | 4,784 | 16.0% |
| > 20% | 1,208 | 4.0% |
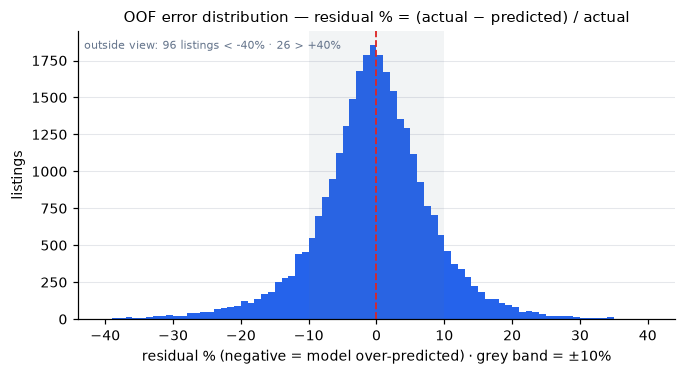
OOF error for all 29,988 listings. The distribution peaks at zero (median residual -0.27%); the share of listings within ±10% is 80.0%. Mean |error| is 6.5% — the MAPE itself; median |error| 4.7%. On the percentage residual the tails look asymmetric: the model says more than 20% above the actual price for 768 listings and more than 20% below it for 440 (extremes -178.1% and +56.5%). All of that comes from the definition: the residual is divided by the actual price, so under-prediction is capped at 100% while over-prediction is unbounded. On a symmetric scale (one side more than 1.2× the other) 768 listings are over-predicted and 812 under-predicted — the asymmetry reverses. The std (9.27%) is inflated by that tail; median |error| describes the typical miss better.
Where the large errors come from
There are 1,208 listings with an error beyond ±20% (768 over-, 440 under-predicted). The breakdowns below are counted from structured fields only — no text detector involved.
| listings of the same model+year | listings | large error | over-predicted | under-predicted |
|---|---|---|---|---|
| 1 | 610 | 19.0% | 10.7% | 8.4% |
| 2–4 | 1,584 | 10.5% | 6.2% | 4.3% |
| 5–19 | 5,732 | 4.7% | 3.0% | 1.7% |
| 20–99 | 16,505 | 3.0% | 1.9% | 1.1% |
| 100+ | 5,557 | 2.9% | 2.0% | 0.9% |
- No comparable. With no other listing of the same model and year the large-error rate is 19.0%; with 100+ comparables 2.9%.
- Exotic or old car. 19.1% in the F/S segments — but those two hold 444 listings in total (F 325 · S 119), so the riskiest bucket is also the thinnest. Others 3.8%; 12.0% at age ≥ 18 (younger 3.2%).
- Time and survival. The median residual changes with the snapshot a listing was last seen in: 2026-01-18 -3.27% → 2026-06-27 +1.38%. Part of this is the period: the model is time-blind and the market moved +1.98% over the span (§9). Part is survival: the 11,526 listings still live in the last snapshot have a median residual of +1.38%, the 18,462 that left earlier -1.24%; even between the first two snapshots, with the market flat (0.00%), the median residual moves -3.27% → -1.75% — listings that left early had been priced below the model's figure.
Age 18 is not a threshold the data picked. The large-error rate rises with age: age 5 0.35% · age 10 1.56% · age 15 7.86% · age 18 11.69% · age 21 15.34%. The largest one-year jump is between 16 and 17 (7.79% → 12.72%). Moving the cut between 8 and 21 keeps the old/young ratio between 3.5× and 6.7×; at 18 it is 3.7×. The oldest bucket also runs into the collection limit: data starts at model year 2005, so the 18-and-over bucket holds only 4 model years.
Association; not verified listing by listing. Information absent from the form (damage history, equipment, modifications) is a likely contributor, not measured here.
Examples
| car | year | km | price | model estimate | residual |
|---|---|---|---|---|---|
| BMW 640i | 2011 | 160,000 | ₺5,600,000 | ₺3,236,953 | +42.2% |
| Audi 4.2 FSI Quattro R-tronic (R8) | 2008 | 112,550 | ₺4,690,000 | ₺2,744,815 | +41.5% |
| BMW 750i Long | 2007 | 271,000 | ₺1,190,000 | ₺2,831,842 | -138.0% |
- BMW 640i · 2011: Per the ad text the car is a full M6 conversion: M6 engine and M6 body parts. The form still says 640i, so the model prices an ordinary 640i while the buyer is looking at an M6.
- Audi 4.2 FSI Quattro R-tronic (R8) · 2008: The only R8 in the data. Its model name on the form is just "4.2 FSI Quattro R-tronic"; the S5 4.2 FSI Quattros sharing that engine name have a median of ₺2.62M, and the model's estimate is close to that. With no comparable, the model priced a supercar like the similarly named S5.
- BMW 750i Long · 2007: There are two listings under this name; the other is a ₺5.3M converted 2009 car. This listing is in line with same-year 730ds (15 listings, median ₺1.18M) and its text says well-maintained with no pending costs. The listing is priced right and the model is wrong: lacking a comparable, it is probably pulled up by the name's other, expensive listing.
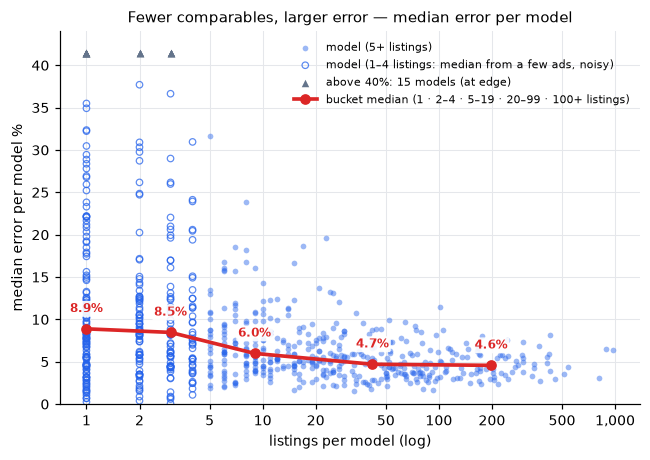
Each point is a model; the y axis is the median error across that model's listings. The bucket median is 8.9% for single-listing models and 4.6% for models with 100+ listings. The table above measures differently in two ways: it counts the rate of large errors and groups listings by model+year. Both point the same way — fewer comparables, larger error.
Conformal interval and coverage
A conformal interval is a data-based price band the model offers alongside its single price (e.g. ₺1.34M – ₺1.78M).
- No distributional assumption: Errors are not assumed to follow a formula (a bell curve, etc.). The model's real errors on cars it has never seen are sorted, the worst 10% are set aside, and the margin is read directly from the data. The one assumption is that new listings resemble past ones — as the market drifts (§9), that assumption weakens.
- Proportional: The margin is applied as a percentage, not in lira (roughly 13% below to 15% above the estimate). So the lira band is wide for expensive cars and narrow for cheap ones.
- Limitation: Because one percentage is applied to the whole market, the band is too narrow for cheap cars, where the model errs more in proportional terms (see the coverage chart below). The fix is to compute the margin separately for each price band instead of as a single number; this was not done in this report.
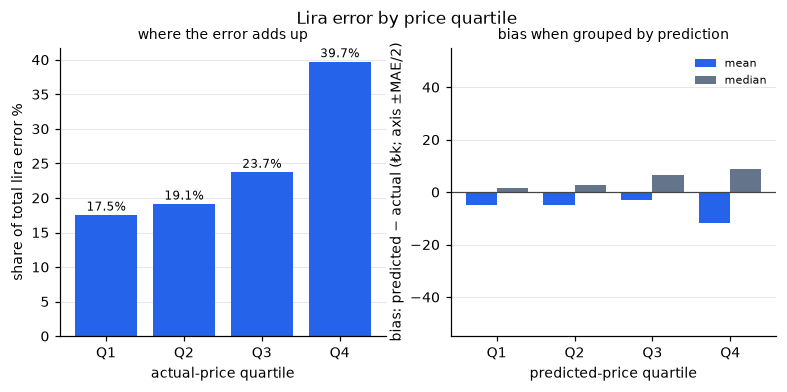
The weakness is price-dependent: median error is 6.96% in the cheapest quartile and 3.59% in the most expensive. The 90% conformal interval does not hold everywhere; Q1 coverage, for instance, is 81.6%.
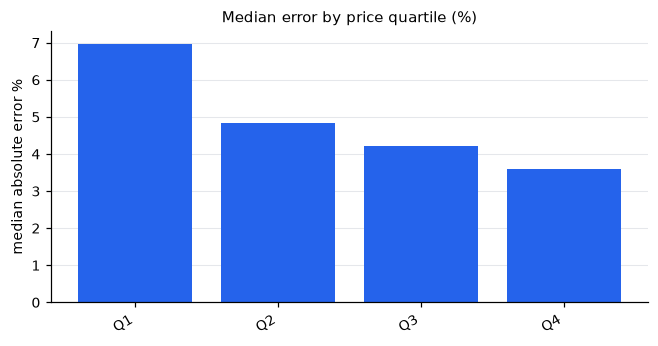
In lira the picture changes: 39.7% of total lira error sits in the most expensive quartile and 17.5% in the cheapest; mean absolute error ₺176K against ₺77K. Grouped by the actual price the mean bias (predicted − actual) is +₺25K in the cheapest quartile and −₺38K in the most expensive; that is regression to the mean, which any noisy prediction shows when grouped by the true value. Grouped by the predicted price (the only thing a pricing tool knows) the mean bias ranges from −₺12K to −₺3K (right panel).
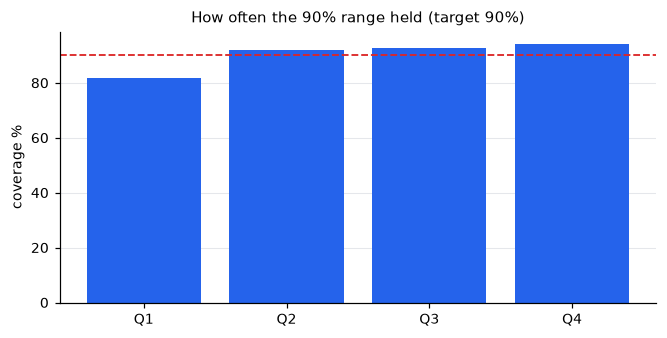
| quartile | price range | coverage |
|---|---|---|
| Q1 | below ₺1.15M | 81.6% |
| Q2 | ₺1.15M – ₺1.55M | 91.8% |
| Q3 | ₺1.55M – ₺2.28M | 92.7% |
| Q4 | above ₺2.28M | 94.0% |
Note: The price quartiles are cut on actual values. Overall coverage is 90.0% by construction; only Q1 falls below the target. Cutting the quartiles on the predicted price gives 81.0% coverage in the cheapest one — the finding does not depend on the grouping.
Best 5 predictions
| model | age | km | actual | OOF pred. | error |
|---|---|---|---|---|---|
| 520d Premium | 14 | 300,000 | ₺1,480,000 | ₺1,480,003 | 0.0% |
| 520i Luxury Line | 4 | 96,000 | ₺3,680,000 | ₺3,680,013 | 0.0% |
| 520i Premium | 11 | 200,000 | ₺1,595,000 | ₺1,594,991 | 0.0% |
| A4 Sedan 40 TDI Advanced | 6 | 149,000 | ₺2,680,000 | ₺2,680,017 | 0.0% |
| 116i Comfort | 17 | 174,000 | ₺718,000 | ₺717,993 | 0.0% |
Across 29,988 listings a few predictions landing within a few lira of the truth is expected by chance alone; this table shows the zero end of the error distribution, not typical quality.
Six largest percentage errors
| model | age | km | actual | OOF pred. | error |
|---|---|---|---|---|---|
| A4 Sedan 2.0 TDI | 20 | 355,000 | ₺644,000 | ₺1,790,840 | 178.1% |
| 750i Long | 19 | 271,000 | ₺1,190,000 | ₺2,831,842 | 138.0% |
| 745i Long | 21 | 280,000 | ₺885,000 | ₺1,921,635 | 117.1% |
| 1.8 1.8 T | 20 | 96,000 | ₺950,000 | ₺1,836,127 | 93.3% |
| M2 | 10 | 153,000 | ₺1,650,000 | ₺3,130,227 | 89.7% |
| 316Ci | 21 | 234,500 | ₺345,000 | ₺621,147 | 80.0% |
In all six of the worst the model says more than the actual price; median age 20. That direction comes largely from the ranking itself: when the model says too little the percentage error cannot exceed 100% (the highest here is 56.5%), while the top 10 of this list needs 72.7%. The lira ranking follows below.
In 1 the cause is the data: engine power or displacement deviates more than 1.5× from the median of its comparable group — the catalogue match collapsed and the model is pricing an engine the car does not have. There are 15 such listings (0.05%) and they are expensive: their median error is 12.8% against 4.7% for the rest. The check only works on models with at least 5 listings: the 632 listings (2.11%) of the 307 smaller models are its blind spot — exactly where comparables are scarcest. In 4 the cause is having no comparables: at most two listings of that model exist. The remaining one fits neither explanation. All predictions are OOF; the listing id (ad_id) is deliberately not published.
Six largest errors in lira
| model | age | km | actual | OOF pred. | pred. − actual |
|---|---|---|---|---|---|
| M3 | 17 | 182,980 | ₺5,850,000 | ₺2,547,649 | −₺3.30M |
| M4 | 12 | 65,000 | ₺6,500,000 | ₺3,285,609 | −₺3.21M |
| M3 | 12 | 50,000 | ₺5,999,000 | ₺2,785,950 | −₺3.21M |
| 520d xDrive M Sport | 8 | 88,200 | ₺6,050,000 | ₺3,203,694 | −₺2.85M |
| M5 | 20 | 97,172 | ₺5,669,000 | ₺3,069,790 | −₺2.60M |
| M6 | 19 | 169,000 | ₺5,750,000 | ₺3,246,669 | −₺2.50M |
In lira the list flips: in 6 of the top six the model says too little. Of the top 100 lira errors 73 are under- and 27 over-predictions; 91 sit in the most expensive quartile. The series that take their segment from the model name (M Serisi, RS, S, i Serisi) are 0.52% of the data but 23 of the top 100 — 44× their share of the data. The price cap (₺6.50M) also truncates the range the model learns at this end; under-prediction on the most expensive listings should be read with that limit in mind.
Time — period effect, distribution drift and backtest
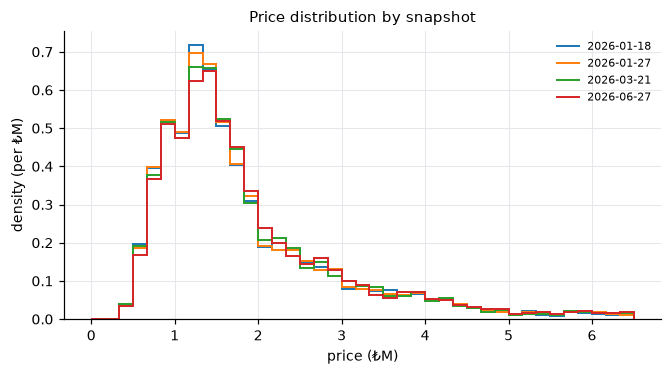
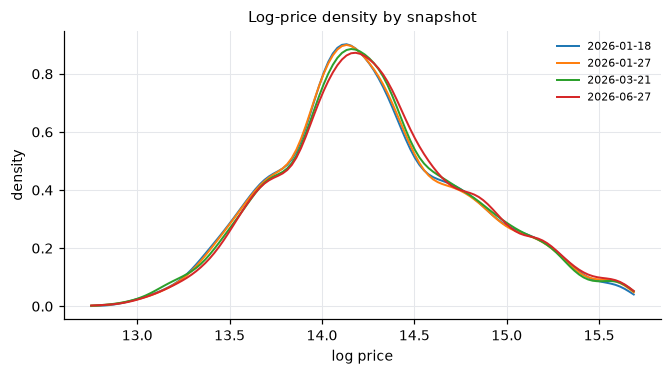
Two measurements. Distribution drift: the price distribution moves little between snapshots (highest PSI 0.005, "no drift" threshold 0.10). Temporal backtest: trained on an earlier snapshot and tested only on a later snapshot's new listings, the error grows with the horizon (6.53% → 7.56%). Within the same model and year the market level moved +2.0% and the model is time-blind → retraining should follow measured drift, not the calendar (end of this section).
Period effect
| snapshot | live market (same model+year) | distribution distance (EMD) |
|---|---|---|
| 01-18 (base) | 0.00% | — |
| 01-27 | 0.00% (776) | ₺10,109 |
| 03-21 | +0.85% (728) | ₺20,560 |
| 06-27 | +1.98% (701) | ₺48,059 |
The two columns answer two different questions. Live market: how the median price moved within the same model and year (cell count in brackets) — free of listing mix, no model assumption. EMD: the average shift needed to line up two periods' price distributions, mix included. The hedonic model carries no period effect; the periods are pooled. The report's model (LightGBM) is time-blind too: it takes no period feature.
Temporal backtest
| single: train → test | MAPE | n | cumulative: train → test | MAPE | n |
|---|---|---|---|---|---|
| 01-18 → 01-27 | 6.53% | 2,960 | ≤01-18 → 01-27 | 6.53% | 2,960 |
| 01-18 → 03-21 | 6.81% | 8,182 | ≤01-18 → 03-21 | 6.81% | 8,182 |
| 01-18 → 06-27 | 7.56% | 10,529 | ≤01-18 → 06-27 | 7.56% | 10,529 |
| 01-27 → 03-21 | 6.59% | 7,413 | ≤01-27 → 03-21 | 6.57% | 7,238 |
| 01-27 → 06-27 | 7.30% | 10,313 | ≤01-27 → 06-27 | 7.36% | 10,257 |
| 03-21 → 06-27 | 7.06% | 9,099 | ≤03-21 → 06-27 | 6.94% | 8,889 |
Single = train on one snapshot, predict a later one. Cumulative = train on every snapshot up to t. The test set holds only ad_ids never seen in training (leak-free); n is the number of those listings and MAPE is over them. E.g. of the 11,254 listings in the 01-27 snapshot, 8,294 were already live in the 01-18 snapshot; the other 2,960 were tested. Cumulative drops every listing seen in any snapshot up to t, so its n is at most the single n. From the same training snapshot, error grows as the test horizon lengthens.
Both arms of this table use a lighter setup than the main model: model and series names enter as raw categoricals without TF-IDF/SVD, 800 trees, no early stopping. Compare rows with each other, not the absolute level with the headline MAPE. The first three rows of the cumulative arm are the same experiment as the single arm (accumulating up to the first snapshot is one snapshot); they are not a second, independent measurement.
Per-snapshot OOF
| snapshot (standalone) | MAPE | n | cumulative | MAPE | n |
|---|---|---|---|---|---|
| 01-18 | 7.07% | 10,901 | ≤01-18 | 7.07% | 10,901 |
| 01-27 | 6.99% | 11,254 | ≤01-27 | 6.77% | 13,861 |
| 03-21 | 7.02% | 11,478 | ≤03-21 | 6.53% | 21,099 |
| 06-27 | 7.25% | 11,526 | ≤06-27 | 6.53% | 29,988 |
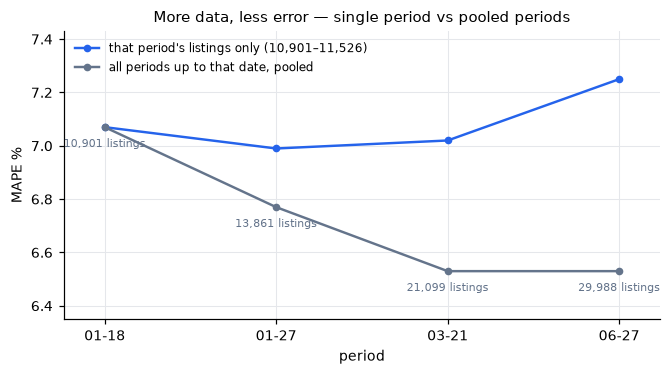
This table is not temporal: every row is plain 5-fold OOF with no new-listings-only rule. The setup is again lighter (no TF-IDF/SVD, 500 trees, no early stopping). The last cumulative row covers the same listings as the headline model and gives 6.53% against a headline MAPE of 6.49%; the setups differ in more than one place, so the gap cannot be attributed to a single change.
Distribution drift
| snapshot pair | KS | KS p | PSI | EMD (₺) |
|---|---|---|---|---|
| 01-18→01-27 | 0.0055 | 0.996 | 0.0004 | ₺10,109 |
| 01-18→03-21 | 0.0173 | 0.070 | 0.0015 | ₺20,560 |
| 01-18→06-27 | 0.0309 | <0.001 | 0.0049 | ₺48,059 |
| 01-27→03-21 | 0.0161 | 0.104 | 0.0011 | ₺15,717 |
| 01-27→06-27 | 0.0301 | <0.001 | 0.0038 | ₺39,115 |
| 03-21→06-27 | 0.0157 | 0.118 | 0.0017 | ₺28,620 |
What the columns measure. All four compare the asking-price distribution of two snapshots (raw price, ₺; every listing live on that day, ~11k per snapshot).
| measure | what it measures, how to read it |
|---|---|
| KS | The point where the two distributions differ most; 0–1. How different is "the share of listings below this price" at worst? 0.031 = 3.1 points apart at the widest point. |
| KS p | Could the difference be chance? Below 0.05 → it is real. But it says nothing about size: with samples of ~11k listings even a tiny difference comes out significant. |
| PSI | Is the difference practically large? The first snapshot's prices are cut into 10 bins; how much did those bin shares move in the second? < 0.10 no drift · 0.10–0.25 moderate · > 0.25 large. |
| EMD (₺) | How many lira is the difference? How far prices must move on average to turn one snapshot's distribution into the other's. The only measure in lira, so the most directly readable one. |
The snapshots are not independent samples. The same listing shows up in several of them: up to 76.1% of the first snapshot's listings (01-18→01-27) are still there in the second. KS assumes two independent samples, so the p-values above are not valid. Below, the listings seen in both snapshots are removed from each pair and KS is recomputed. That disjoint comparison restores independence but measures something else: listings that left after the first snapshot against listings that arrived later.
| snapshot pair | shared (share of first) | KS (disjoint) | KS p (disjoint) | EMD (disjoint, ₺) |
|---|---|---|---|---|
| 01-18→01-27 | 76.1% | 0.0161 | 0.860 | ₺35,324 |
| 01-18→03-21 | 30.2% | 0.0229 | 0.031 | ₺26,389 |
| 01-18→06-27 | 9.1% | 0.0334 | <0.001 | ₺51,115 |
| 01-27→03-21 | 36.1% | 0.0247 | 0.022 | ₺24,206 |
| 01-27→06-27 | 10.8% | 0.0331 | <0.001 | ₺42,804 |
| 03-21→06-27 | 21.1% | 0.0210 | 0.036 | ₺37,666 |
What the drift table says. Five pairs have a disjoint KS p below 0.05 (two after a Holm correction for six tests: 01-18→06-27, 01-27→06-27) — in those pairs the price distribution of listings that left between snapshots differs from that of listings that arrived later. Between full snapshots the difference is small: the highest PSI is 0.0049, about 20× below the "no drift" threshold (0.10). EMD puts it in lira (full snapshots, shared listings included): ~₺10k over nine days, ~₺48k over five months — about 3% of the median asking price (₺1.55M). Of the listings in the first of the two closest snapshots, 76.1% are still in the second, so their distance comes out small. On the disjoint subsets EMD does not grow steadily with the gap.
When to retrain
- Watch drift, retrain the model. Run a drift service in production that watches PSI · KS · EMD, and retrain the model on new snapshots. A fixed PSI threshold is not enough: today's highest PSI is 0.0049, yet in the backtest above MAPE rises 6.53% → 7.56% as the test horizon lengthens from the same training snapshot. Per-snapshot standalone OOF is flat, so that is pure time: the model ages even while the distribution barely moves.
- Events that reset the pricing regime. A tax or excise change, an incentive, an import rule, a currency move or a sudden market anomaly can shift the distribution before a monitoring window closes; treat those as triggers as well and plan retraining around them.
- Accumulated data pays. Per-snapshot OOF stays flat at 6.99%–7.25% while the cumulative figure falls 7.07% → 6.53% (n 10,901 → 29,988). Retrain by adding snapshots, not by discarding the old ones.
Free text: measured, left out
The seller's description does not enter the model. That is a measurement, not an oversight: the structural model scores R² 0.9645 and adding text features gives 0.9660 — ΔR² 0.0015: 4.2% of the log variance the structural model leaves unexplained.
These two numbers come from a separate run set up differently from this report: the baseline has no model or series name, 300 trees, 6 categorical and 8 numeric features; so the baseline R² should not be read against the 0.9745 in §7. What matters is the gap between the two arms, not the level.
Pulling structured facts out of the text was tried separately: LangExtract with gemini-3.1-flash-lite extracted damage, maintenance, modification phrases from 13,904 ad texts, each with a part and a state attribute; 13,867 of those texts belong to listings in the model (46.2% of the model's listings).
The extractions themselves entered neither the model nor this report, because their accuracy could not be measured. The one indirect link: the modification word list (not the conversion pattern) behind the text flag in §7 and the example reasons in §8 was distilled from their vocabulary; the flag itself is a plain word rule applied to the ad text. Measuring it needs a balanced validation set of easy, medium and hard listings, labelled by hand; without that work there is no way to know when the extraction is wrong. We did not build decisions on a signal we could not measure.
What it would take is clear: validate the extractions, then feed them to the model as a clean signal and test the gain under the same protocol. The obstacle is sample size: 3,107 listings (10.4%) mention a conversion or modification in their text, and how many of them really are modified is unknown; with too few verified examples the model cannot learn the signal — it stays noise. There is also an alternative route: keep the signal out of the model and drop those listings from the data, then measure how far the error falls. Either way the result has to be tested on live listings before it is trusted.