Decision note
Used Car Market Analysis — Decision Note
For: the pricing team and the dealership. Decision: the model can serve as the primary reference in a price-suggestion tool, but not on its own for cheap (below ₺1.15M), comparable-less or old (roughly 18+) cars. Gain: about ₺81K less pricing error per car. Limit: it predicts the asking price, not the sale price.
What's it worth?
The comparable median — the middle price of the same model and year; with no comparable that year, the model's all-year median, and failing that the whole market's — misses by ₺191K on average; the model by ₺110K — 43% better, ₺81K per car. Across a 100-car stock that is about ₺8M of pricing error. On the listings that do have a comparable (97.5%) the baseline misses by ₺179K and the model by ₺106K: ₺73K per car, 41%.
Beyond model and year the gap is closed mostly by mileage and damage: removing them from the model grows the (root-mean-square) error by ₺55K and ₺25K respectively. The engine information is largely in the model name already: removing that group on its own adds only ₺524.
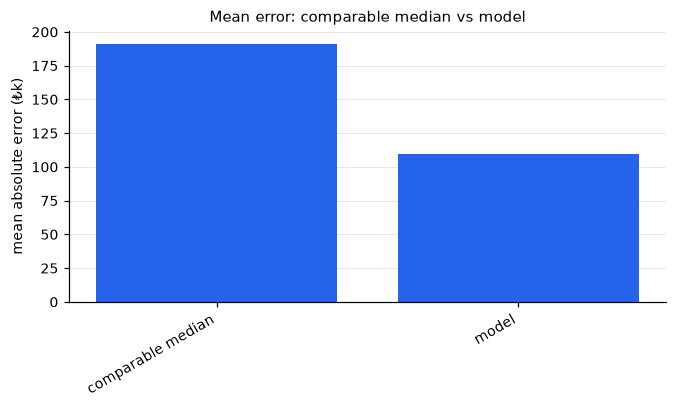
Without a comparable the baseline collapses — mean error at the bottom tier is 6.1× the top. The model struggles without comparables too — where, further down.
| baseline tier | listings | share | mean error |
|---|---|---|---|
| model + year | 29,236 | 97.49% | ₺179K |
| model | 596 | 1.99% | ₺559K |
| global | 156 | 0.52% | ₺1.10M |
How this market builds a price
How much each driver moves the price — with everything else held fixed:
| driver | price |
|---|---|
| age (per year, at a typical car) | -6.6% |
| mileage (per 100k km, at a typical car) | -15.1% |
| heavy-damage record | -11.6% |
| changed panel (each) | -3.1% |
| painted panel (each) | -1.1% |
| +100 hp of engine power | +19.9% |
Age and mileage are linked axes; the age and km rows above are each measured with the other held fixed, at a typical car (11 years, 181,000 km).
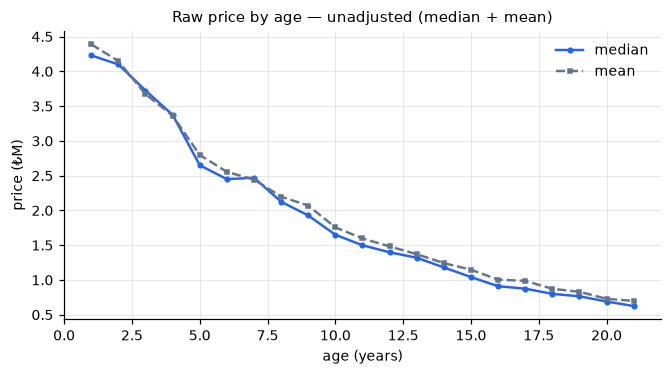
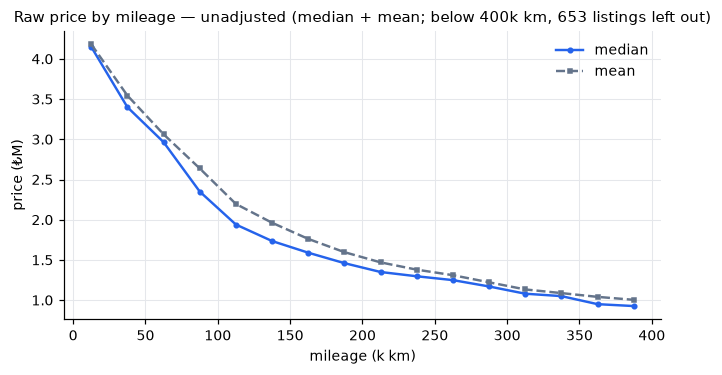
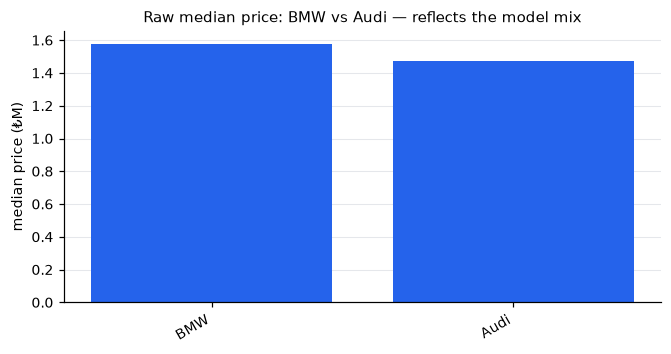
Brand gives you nothing to act on. Adding brand on top of series+model does not move the mean error — brand already lives inside model.
Where not to trust the number
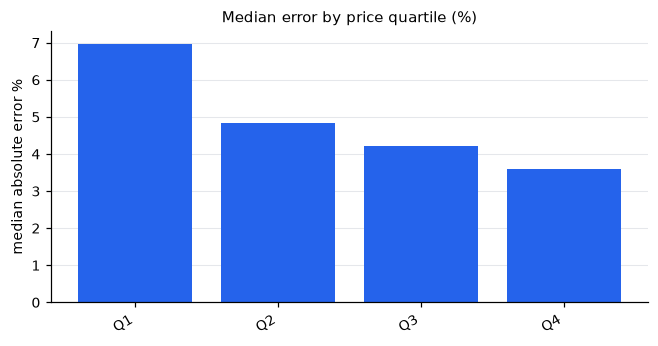
In percentage terms the model struggles on cheap cars — error varies sharply by price quartile.
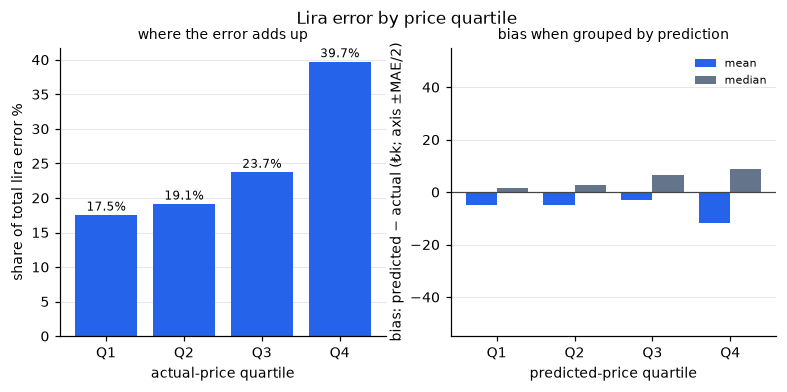
In lira the picture flips. The largest share of total lira error (39.7%) sits in Q4; mean absolute error is ₺176K in the most expensive quartile and ₺77K in the cheapest. Grouped by the predicted price (the only thing the tool knows) the model is not noticeably biased in any quartile: the slope of actual on predicted price is 1.003.
The fewer the comparables, the higher the large-miss rate (beyond ±20%). With no other listing of the same model and year the rate is 19.0%; with 100+ comparables 2.9%. Top/sport segments (19.1%) and cars aged 18 or older (12.0%) are risky too; overall 4.0%.
Why a range, not a single number
An asking-price error costs money in both directions: over-estimating hits the buyer — they overpay; under-estimating hits the seller — the car goes too cheap. A single number hides how sure the estimate is; a range states it and warns the user exactly where uncertainty is large.
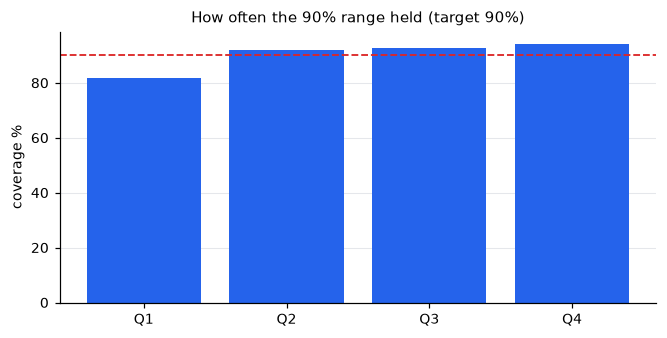
That is why the output is a 90% range, not one number. But the range does not hold on cheap cars: actual coverage in the cheapest quartile is 81.6%, below target.
What to do
- Widen the range on cheap cars — don't trust a point estimate.
- Price rare and edge cars by hand; the model scatters there.
- Review a listing whose text mentions a conversion, an engine swap or modifications before it goes live: that information is not in the form. With vehicle attributes held fixed no significant difference in its error rate was measured; the review guards against what the form cannot see, not against model error.
- Watch drift and retrain the model: run a service that tracks the price distribution, and retrain the model on new data. The price distribution moves little today (highest PSI 0.005), but the market level moved +2.0% over four snapshots and the model is time-blind.
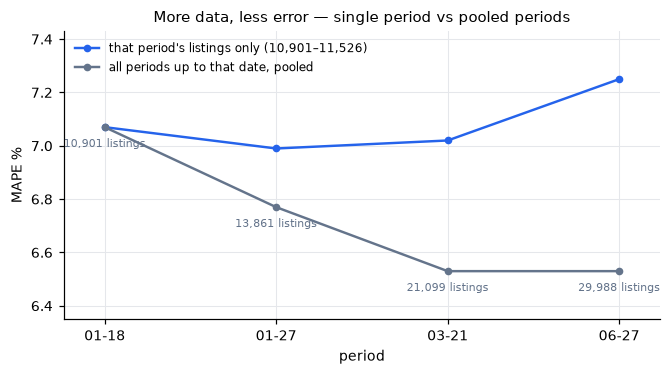
- Watch for events that reset the pricing regime (a tax or excise change, an incentive, a sudden market move) — plan retraining around them. Do not discard old snapshots: more data means less error.
What this model does not give you
- The sale price. It predicts the asking price; the sale price lands below it after haggling.
- Causation. These are controlled associations; it won't say "repaint it and the price drops".
- The value of one specific damaged car. The model sees damage at panel and panel-group level (painted · changed · heavy-damage record) but not its severity: a light scratch and a deep dent land on the same "painted" flag.
- Equipment beyond the package, and modifications. The trim package in the model name (M Sport, S Line and the like) is read; options outside the package and later changes are not visible.
- Anything outside BMW and Audi. Scope is these two brands; how far it generalises to other brands was not measured.
Scale: 29,988 listings, 4 scrape snapshots. Data: 2026-01-18 – 2026-06-27. Median asking price ₺1.55M.